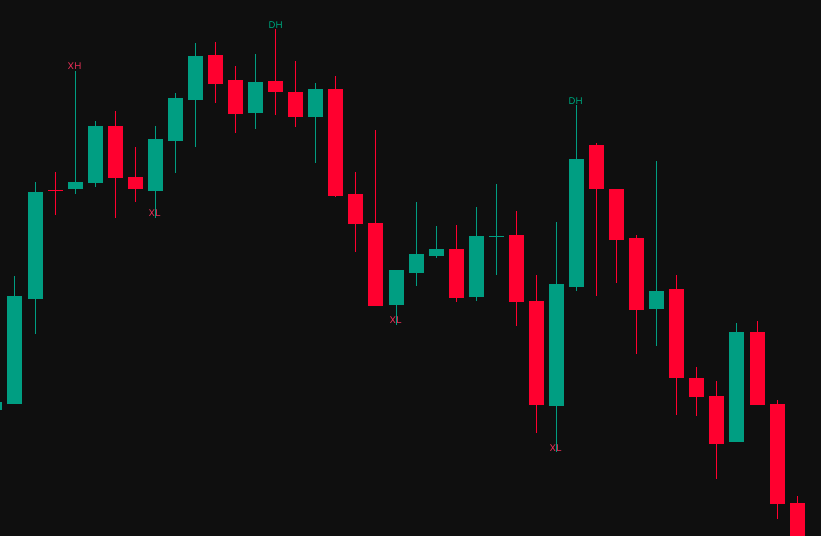
Layer 01
The range, and which side is holding
A high is either still defended or it has already been taken, and the marker says which. That is what fixes the dealing range — and it is the step everyone eyeballs and half of them get wrong.
You do not need a tenth concept. You need the range settled, the bias settled, and one point of interest inside it worth waiting for. DOL Matrix puts all four on the chart and leaves them there.
Order blocks, breakers, gaps, inversions, voids, killzones. You know the material. The markup was never the bottleneck — by the time the session opens there are forty things on the chart and every one of them is arguable in both directions.
So the morning becomes a negotiation with yourself. Bullish on the four-hour, bearish on the fifteen, and whichever one you looked at last is the one you act on. Then the low you were leaning on gets taken, the bias flips with it, and the range you measured premium and discount from turns out to have been the wrong range all along.
The expensive part is not the losing trade. It is the clean one you skipped because you had already argued yourself out of the direction, and the three you took in premium telling yourself it was discount.
DOL Matrix settles the range, the bias, the draw and the point of interest before you sit down — and keeps them settled until the structure itself changes them.
Almost every bad day starts the same way: the range was measured off the wrong swing, so premium read as discount, so the entry was taken on the wrong side of a move that was already extended. Everything downstream of a wrong range is wrong with it.
DOL Matrix fixes the range first and the rest follows from it. Equilibrium across the middle, premium and discount shaded either side, the draw projected forward, the invalidation marked early. Not a retracement tool you drag on and adjust until it agrees with you — it is simply there, and it moves only when the structure moves.
What that buys you is not more trades. It is permission to skip. If the gap is in premium and the draw is below it, there is nothing to think about, and the hour you would have spent talking yourself into it is yours.
Every layer switches off individually. Reduce it to the range and the draw alone if that is all you want from it.
Each one closes a question you would otherwise reopen every session. None of them tells you what to do.
A high is either still defended or it has already been taken, and the marker says which. That is what fixes the dealing range — and it is the step everyone eyeballs and half of them get wrong.
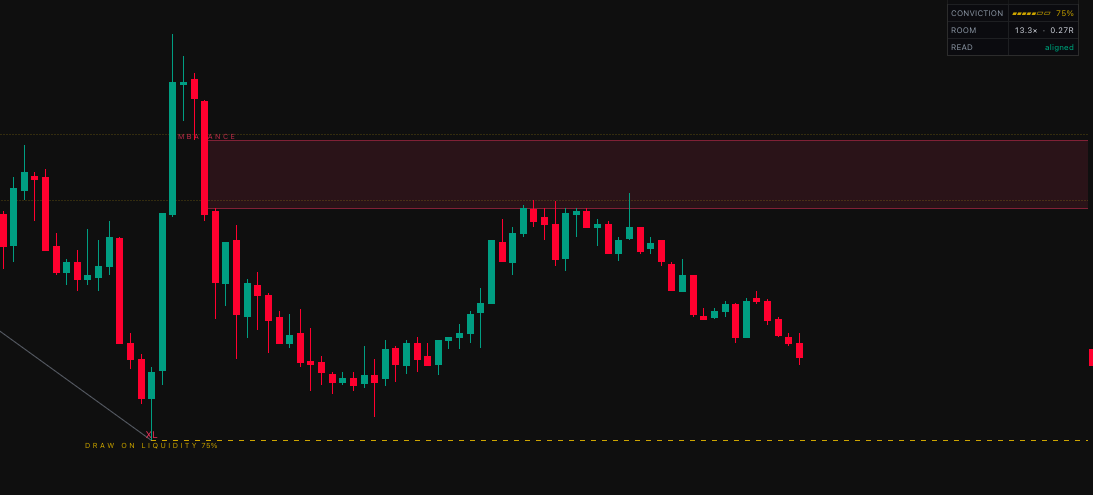
One gold level projected forward: where the range is working to. Never two. If the structure will not support naming one, none is drawn — which is itself an answer, and a cheaper one than guessing.
Where the idea is finished is on the chart before you enter, not improvised once price is against you and the stop has started moving down the screen.
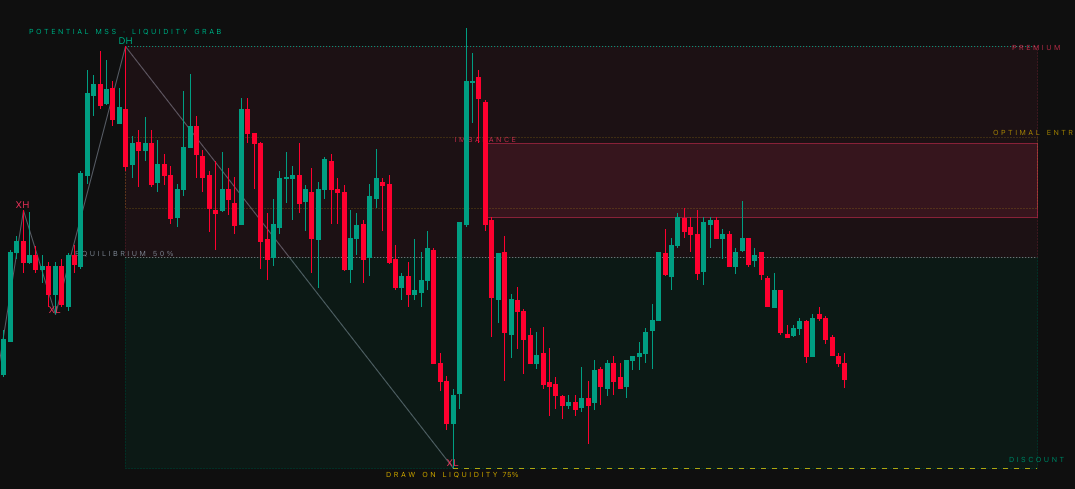
The range split at equilibrium and shaded either side. Buying in premium stops being something you discover in the review, an hour after the fill.
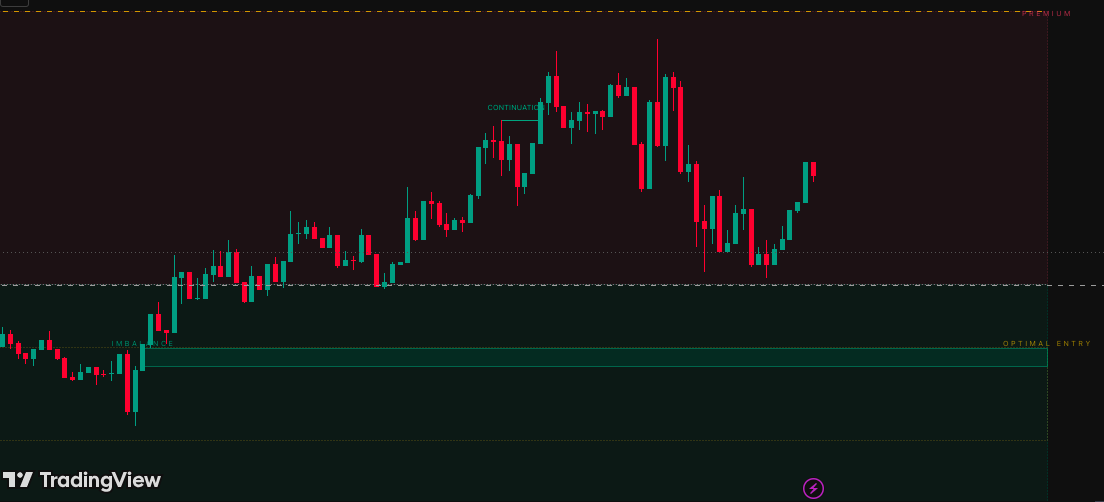
Fair value gaps, order blocks and raids are shown only where they sit on the correct side of the range for the current read, and they clear once price has used them.
Every reading carries a conviction figure, and it is shown by default with the filter switched off. The tool reports and you decide. Most tools invert that, and quietly hide whatever they are least sure of.
When the structure supports nothing, nothing is drawn — and READ names which check withheld it: forming, too tight, conflicted, unfamiliar or learning. An empty chart is an answer, and you are told which answer it is.
A tool that always has something to say is not reading the chart. It is filling the space.
Example values. Conviction is computed from your symbol's own history and will differ — including, often, reading blank while it learns.
The reading is drawn whenever the structure supports one, and the score is printed beside it. The tool does not quietly withhold a level because it scored the reading poorly — it shows you the level and the number and lets you weigh them.
That matters because the number is only ever an estimate of the odds. Treating it as a verdict would hand your judgement to a k-nearest-neighbour vote over a few hundred past setups, which is not a thing worth outsourcing a decision to.
If you would rather it filtered, one setting turns that on. It ships off.
Score and payoff shown beside it. Nothing hidden from you.
Readings below your threshold stay off the chart. One switch, off by default.
Nothing to download, no licence file, no key to keep somewhere safe.
One payment. You land on the access form straight afterwards.
Access is granted to the handle, not to a device, so it follows you anywhere you sign in.
DOL Matrix is waiting there. One click puts the range, the bias and the draw on the chart.
They are the settings the work was done on. Change colours freely; leave the rest for a week.
One dealing range, one bias, one draw, one point of interest — settled before you sit down and held until the structure changes them. The October rate stays yours while the subscription remains active.
€19 monthly or €182 yearly through 31 October. Then €89 monthly or €854 yearly for new subscriptions.